
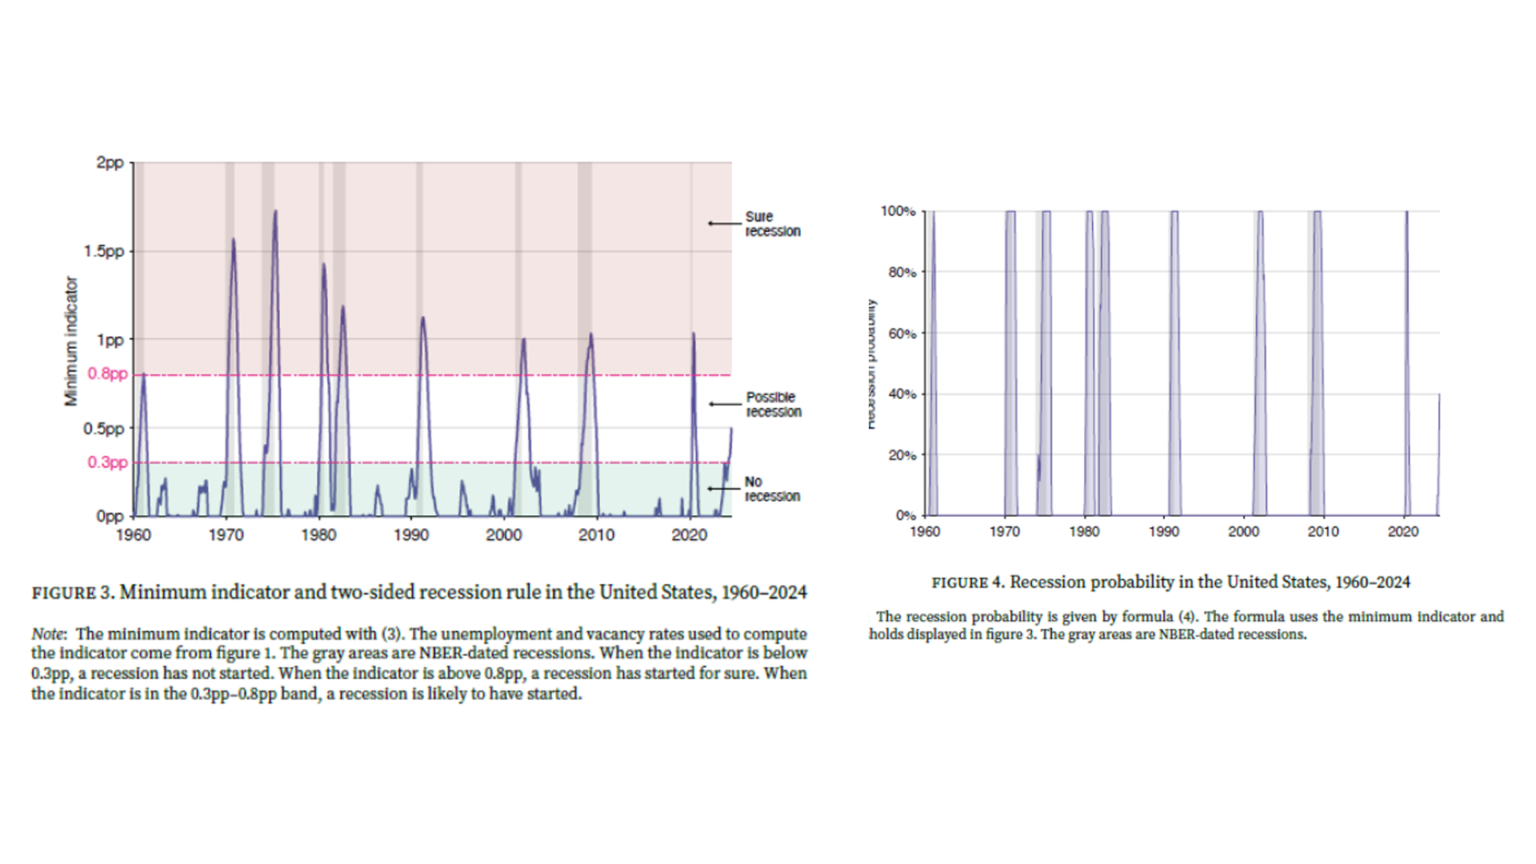
To answer this question, we create a new Sahm-type recession indicator that combines unemployment and vacancy data. The indicator consists of two parts: the difference between the 3-month trailing average of the unemployment rate and its minimum over the previous 12 months,
which is the Sahm indicator; and the difference between the 3-month trailing average of the vacancy rate and its maximum over the previous 12 months, an indicator constructed in a similar way using the vacancy rate. We then propose a two-sided recession rule:
A recession may have begun when our indicator reaches 0.3 pp, and it is certain to have begun when the indicator reaches 0.8 pp. The Sahm rule detects recessions 2.6 months after they begin, whereas this new rule detects them 1.4 months earlier on average. In other words, this new rule activates earlier than the Sahm rule.
The Sahm rule falters before 1960, while the new rule has a better historical record, accurately identifying every recession since 1930. Using data from July 2024, our indicator stands at 0.5 pp, meaning there is a 40% chance that the US economy is currently in a recession. In fact, it is possible that the recession began in March 2024.
After normalizing the NBER indices to the high of 2024M03, we obtain the following figure.
Figure 1: Manufacturing and trade sales in Ch.2017$ (black), monthly GDP in Ch.2017$ (pink), GDP (blue bars), nonfarm payroll (NFP) employment from CES (bold blue), civilian employment (orange),
industrial production (red), and personal income excluding current transfers in Ch.2017$ (bold green). All series are log-normalized to 2023M04=0. Sources: Federal Reserve, S&P Global Market Insights (formerly Macroeconomic Advisers, IHS Market) (8/1/2024 release), BLS via FRED, BEA 2024Q2 advance report, and author’s calculations.
Additionally, substitute indicators:
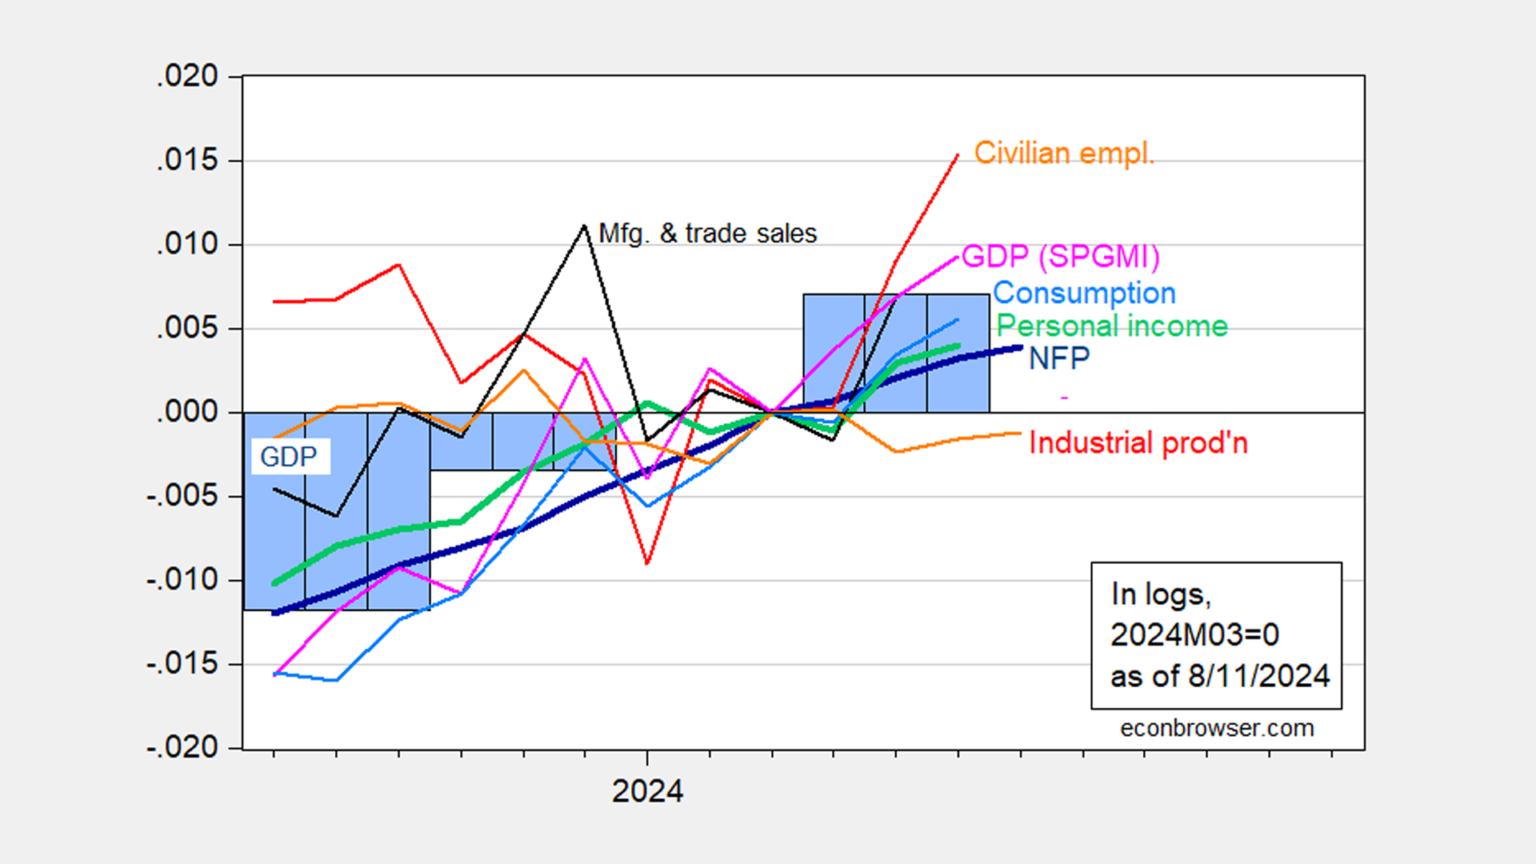
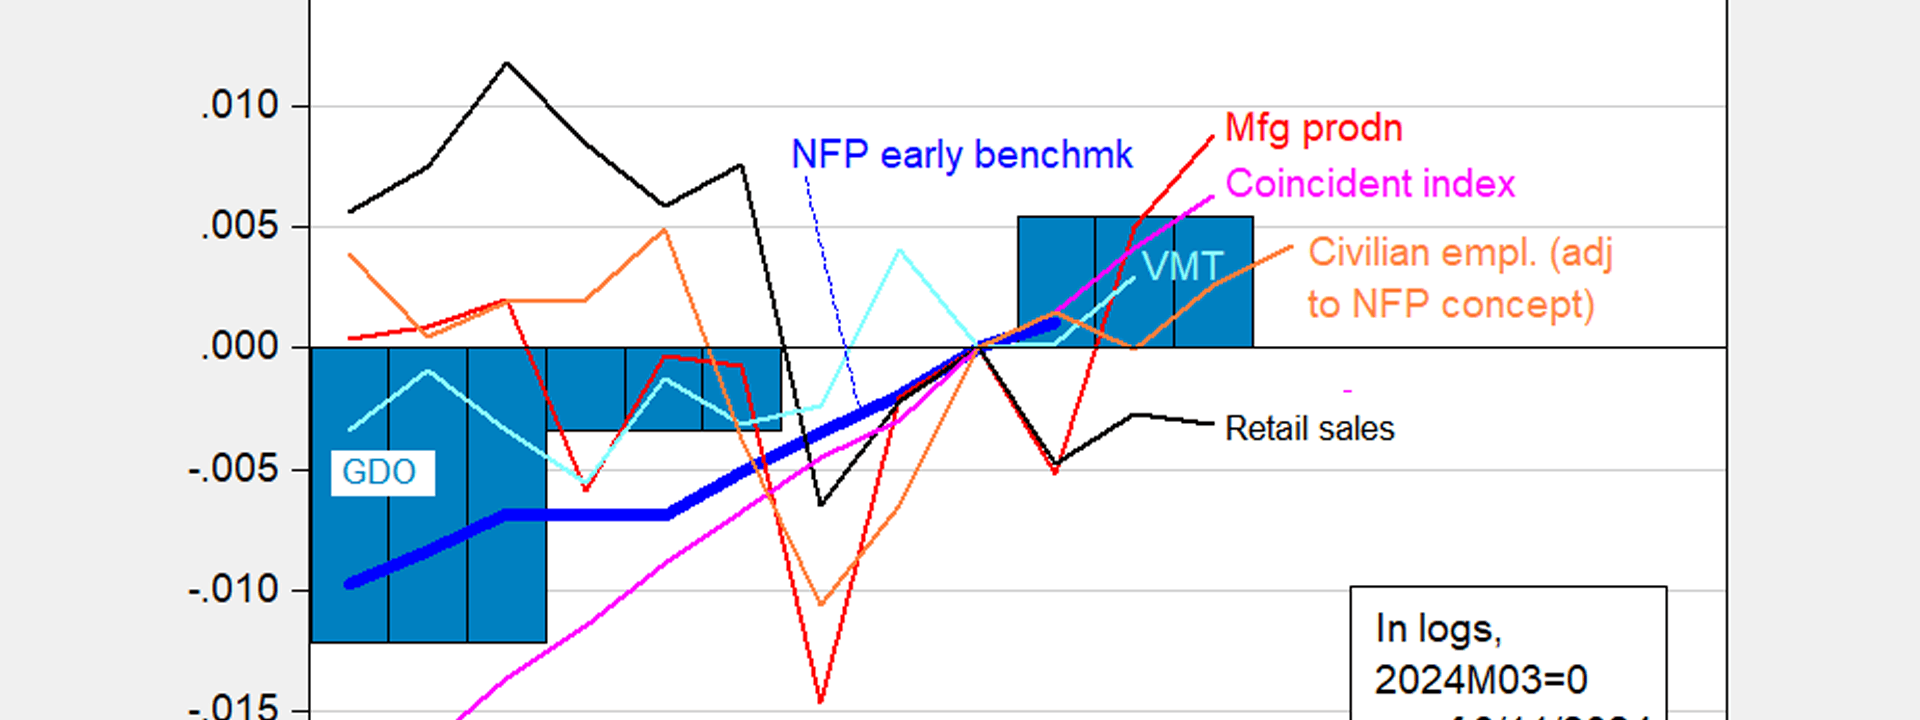
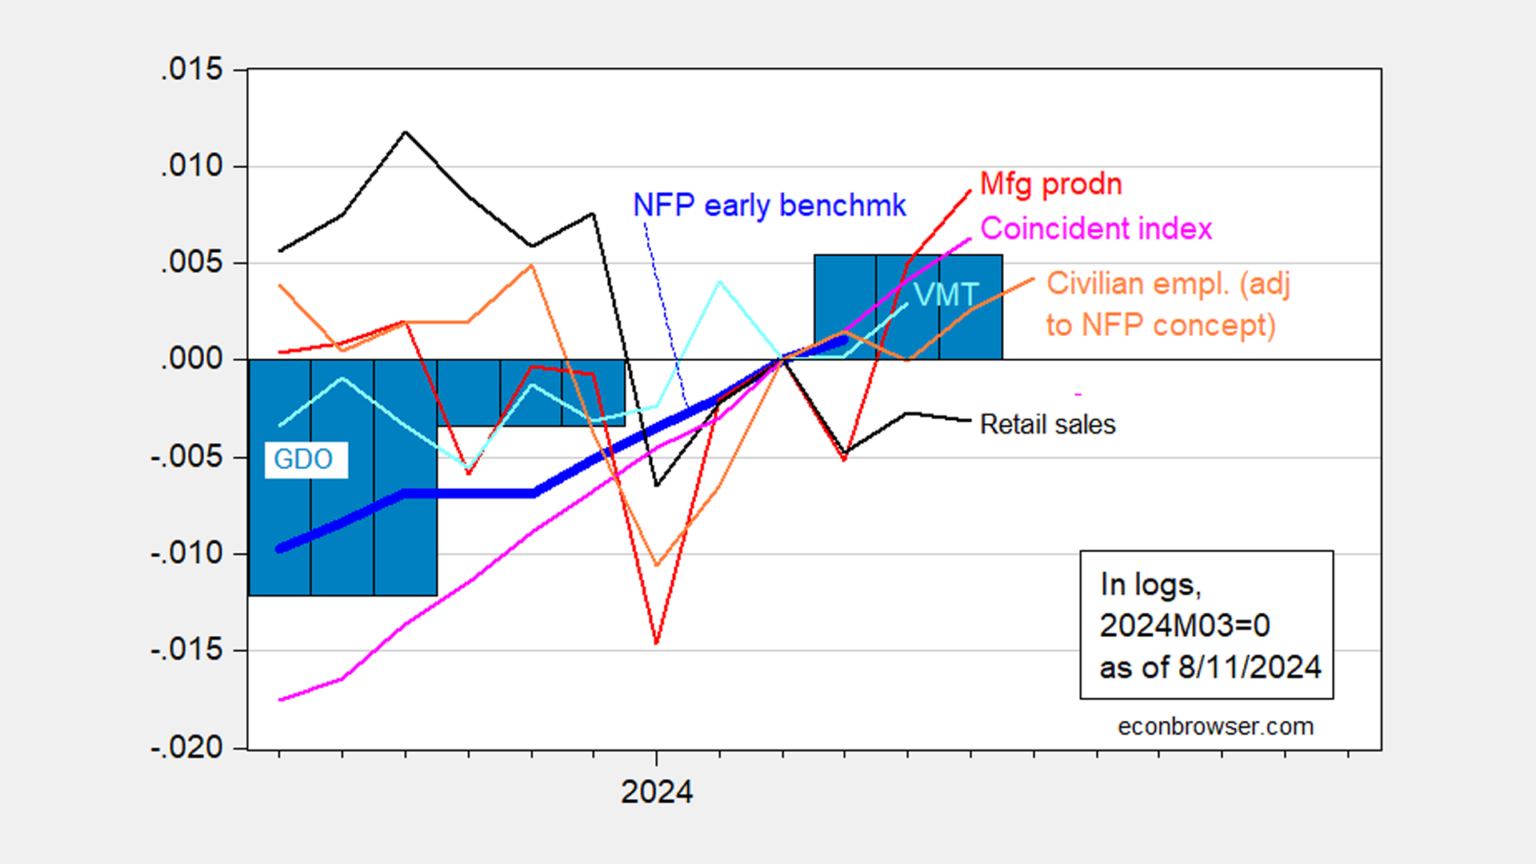
Figure 2: Manufacturing production (red), retail sales (black), vehicle miles traveled (light blue), Coincident Index (light pink), GDO (blue bars), civilian employment adjusted to NFP concept (orange), and nonfarm payroll (NFP) employment (Philadelphia Fed early benchmark, bold blue).
All data are log-normalized to 2023M04=0. GDI was used to estimate GDO for 2024Q2 by using GDP, the lagged surplus, and the lagged differenced surplus over 2021Q1–2024Q1 to project the net operating surplus for 2024Q2. Source:
Author’s calculations, and BLS via FRED, Federal Reserve, BEA 2024Q2 advance release, and Philadelphia Fed. While all of these series will undoubtedly be revised to varying degrees, GDP is the most vulnerable, which is why NBER’s BCDC gives it the least weight.